折腾:
后,去手动设置了map中的颜色范围:
<script type=”text/javascript”> const ValueColor = { RED : ‘#F56954′, //rgb(245, 105, 84)’, GRAY : ‘#D2D654′, //rgb(210, 214, 222)’, GREEN : ‘#00A65A’, //rgb(0, 166, 90)’, YELLOW : ‘#F39C12′, //rgb(243, 156, 18)’, LIGHT_BLUE : ‘#00C0EF’, //’rgb(0, 192, 239)’, DARK_BLUE : ‘#3C8DBC’, //’rgb(60, 141, 188)’, WHITE : ‘#FFFFFF’, //’rgb(255, 255, 255)’, }; </script> <script type=”text/javascript”> var mapEcharts = echarts.init(document.getElementById(‘echart_map’)); option = { title: { text: ”, subtext: ”, left: ‘center’ }, tooltip: { trigger: ‘item’ }, legend: { orient: ‘vertical’, left: ‘left’, // data:[‘2017年’] }, visualMap: { show: false, min: 0, max: 500, // max: 450, left: ‘left’, top: ‘bottom’, text: [‘高’, ‘低’], // 文本,默认为数值文本 calculable: false, // calculable: true, inRange: { //color: [ ‘#e0f3f8’, ‘#ffffbf’, ‘#fee090’, ‘#fdae61’, ‘#f46d43’, ‘#d73027’, ‘#a50026’] // color: [ ‘#FF0033’, ‘#22BF2E’] //AdminLTE: red, green // color: [ ‘#DD4B39’, ‘#00A65A’] color: [ ValueColor.RED, ValueColor.GREEN] //other: red, green // color: [ ‘#FF4500’, ‘#7FFF00’] } }, |
效果是:
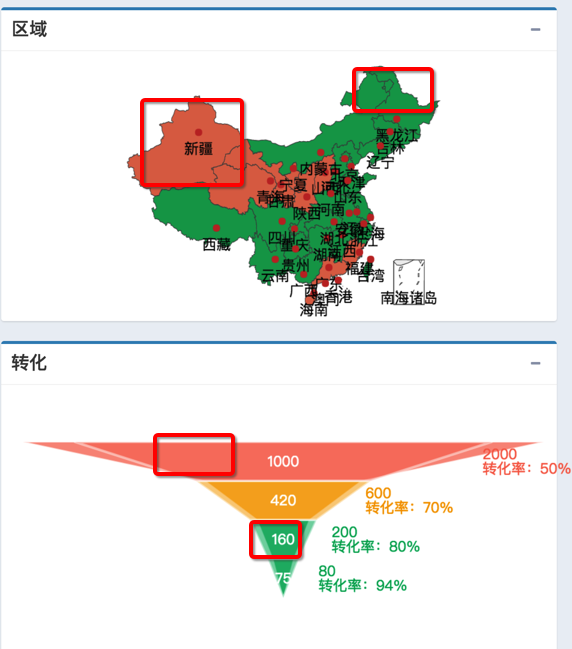
很明显,和下面的红色和绿色,都不一样。
即:
此处map中
inRange中设置的颜色值,和实际显示出来的颜色,是不一致的。
目测,感觉可能和ECharts的theme主题有关系?
去想办法搞清楚,如何精确设置map中的颜色。
echarts map 颜色
map地图省份标色 · Issue #301 · ecomfe/echarts
刷新,map 给data[]设置不同颜色 · Issue #3042 · ecomfe/echarts
echarts如何让地图map不同区块颜色不同 · Issue #4067 · ecomfe/echarts
去加了:
geo: { show: true, map: ‘china’, regions: [{ name: ‘广东’, itemStyle: { normal: { areaColor: ValueColor.DARK_BLUE, color: ValueColor.DARK_BLUE } } }] }, |
但是颜色没有设置成功。
还是去研究一下:
visualMap
的配置吧。
http://echarts.baidu.com/option.html#visualMap
看到其中的:
colorLightness: [0.8, 0.2]
感觉是:
此处设置的值,是明暗的程度
-》所以不是和原始颜色值一一对应。
-》难道是:
换成:
type: piecewise
就可以了?
去试试
参考:
http://echarts.baidu.com/gallery/editor.html?c=doc-example/scatter-visualMap-piecewise
结果试了试:
<script type=”text/javascript”> var mapEcharts = echarts.init(document.getElementById(‘echart_map’)); var geoCoordMap = { “海门”:[121.15,31.89], “鄂尔多斯”:[109.781327,39.608266], “招远”:[120.38,37.35], “舟山”:[122.207216,29.985295], “齐齐哈尔”:[123.97,47.33], “盐城”:[120.13,33.38], “赤峰”:[118.87,42.28], “青岛”:[120.33,36.07], “乳山”:[121.52,36.89], “金昌”:[102.188043,38.520089], “泉州”:[118.58,24.93], “莱西”:[120.53,36.86], “日照”:[119.46,35.42], “胶南”:[119.97,35.88], “南通”:[121.05,32.08], “拉萨”:[91.11,29.97], “云浮”:[112.02,22.93], “梅州”:[116.1,24.55], “文登”:[122.05,37.2], “上海”:[121.48,31.22], “攀枝花”:[101.718637,26.582347], “威海”:[122.1,37.5], “承德”:[117.93,40.97], “厦门”:[118.1,24.46], “汕尾”:[115.375279,22.786211], “潮州”:[116.63,23.68], “丹东”:[124.37,40.13], “太仓”:[121.1,31.45], “曲靖”:[103.79,25.51], “烟台”:[121.39,37.52], “福州”:[119.3,26.08], “瓦房店”:[121.979603,39.627114], “即墨”:[120.45,36.38], “抚顺”:[123.97,41.97], “玉溪”:[102.52,24.35], “张家口”:[114.87,40.82], “阳泉”:[113.57,37.85], “莱州”:[119.942327,37.177017], “湖州”:[120.1,30.86], “汕头”:[116.69,23.39], “昆山”:[120.95,31.39], “宁波”:[121.56,29.86], “湛江”:[110.359377,21.270708], “揭阳”:[116.35,23.55], “荣成”:[122.41,37.16], “连云港”:[119.16,34.59], “葫芦岛”:[120.836932,40.711052], “常熟”:[120.74,31.64], “东莞”:[113.75,23.04], “河源”:[114.68,23.73], “淮安”:[119.15,33.5], “泰州”:[119.9,32.49], “南宁”:[108.33,22.84], “营口”:[122.18,40.65], “惠州”:[114.4,23.09], “江阴”:[120.26,31.91], “蓬莱”:[120.75,37.8], “韶关”:[113.62,24.84], “嘉峪关”:[98.289152,39.77313], “广州”:[113.23,23.16], “延安”:[109.47,36.6], “太原”:[112.53,37.87], “清远”:[113.01,23.7], “中山”:[113.38,22.52], “昆明”:[102.73,25.04], “寿光”:[118.73,36.86], “盘锦”:[122.070714,41.119997], “长治”:[113.08,36.18], “深圳”:[114.07,22.62], “珠海”:[113.52,22.3], “宿迁”:[118.3,33.96], “咸阳”:[108.72,34.36], “铜川”:[109.11,35.09], “平度”:[119.97,36.77], “佛山”:[113.11,23.05], “海口”:[110.35,20.02], “江门”:[113.06,22.61], “章丘”:[117.53,36.72], “肇庆”:[112.44,23.05], “大连”:[121.62,38.92], “临汾”:[111.5,36.08], “吴江”:[120.63,31.16], “石嘴山”:[106.39,39.04], “沈阳”:[123.38,41.8], “苏州”:[120.62,31.32], “茂名”:[110.88,21.68], “嘉兴”:[120.76,30.77], “长春”:[125.35,43.88], “胶州”:[120.03336,36.264622], “银川”:[106.27,38.47], “张家港”:[120.555821,31.875428], “三门峡”:[111.19,34.76], “锦州”:[121.15,41.13], “南昌”:[115.89,28.68], “柳州”:[109.4,24.33], “三亚”:[109.511909,18.252847], “自贡”:[104.778442,29.33903], “吉林”:[126.57,43.87], “阳江”:[111.95,21.85], “泸州”:[105.39,28.91], “西宁”:[101.74,36.56], “宜宾”:[104.56,29.77], “呼和浩特”:[111.65,40.82], “成都”:[104.06,30.67], “大同”:[113.3,40.12], “镇江”:[119.44,32.2], “桂林”:[110.28,25.29], “张家界”:[110.479191,29.117096], “宜兴”:[119.82,31.36], “北海”:[109.12,21.49], “西安”:[108.95,34.27], “金坛”:[119.56,31.74], “东营”:[118.49,37.46], “牡丹江”:[129.58,44.6], “遵义”:[106.9,27.7], “绍兴”:[120.58,30.01], “扬州”:[119.42,32.39], “常州”:[119.95,31.79], “潍坊”:[119.1,36.62], “重庆”:[106.54,29.59], “台州”:[121.420757,28.656386], “南京”:[118.78,32.04], “滨州”:[118.03,37.36], “贵阳”:[106.71,26.57], “无锡”:[120.29,31.59], “本溪”:[123.73,41.3], “克拉玛依”:[84.77,45.59], “渭南”:[109.5,34.52], “马鞍山”:[118.48,31.56], “宝鸡”:[107.15,34.38], “焦作”:[113.21,35.24], “句容”:[119.16,31.95], “北京”:[116.46,39.92], “徐州”:[117.2,34.26], “衡水”:[115.72,37.72], “包头”:[110,40.58], “绵阳”:[104.73,31.48], “乌鲁木齐”:[87.68,43.77], “枣庄”:[117.57,34.86], “杭州”:[120.19,30.26], “淄博”:[118.05,36.78], “鞍山”:[122.85,41.12], “溧阳”:[119.48,31.43], “库尔勒”:[86.06,41.68], “安阳”:[114.35,36.1], “开封”:[114.35,34.79], “济南”:[117,36.65], “德阳”:[104.37,31.13], “温州”:[120.65,28.01], “九江”:[115.97,29.71], “邯郸”:[114.47,36.6], “临安”:[119.72,30.23], “兰州”:[103.73,36.03], “沧州”:[116.83,38.33], “临沂”:[118.35,35.05], “南充”:[106.110698,30.837793], “天津”:[117.2,39.13], “富阳”:[119.95,30.07], “泰安”:[117.13,36.18], “诸暨”:[120.23,29.71], “郑州”:[113.65,34.76], “哈尔滨”:[126.63,45.75], “聊城”:[115.97,36.45], “芜湖”:[118.38,31.33], “唐山”:[118.02,39.63], “平顶山”:[113.29,33.75], “邢台”:[114.48,37.05], “德州”:[116.29,37.45], “济宁”:[116.59,35.38], “荆州”:[112.239741,30.335165], “宜昌”:[111.3,30.7], “义乌”:[120.06,29.32], “丽水”:[119.92,28.45], “洛阳”:[112.44,34.7], “秦皇岛”:[119.57,39.95], “株洲”:[113.16,27.83], “石家庄”:[114.48,38.03], “莱芜”:[117.67,36.19], “常德”:[111.69,29.05], “保定”:[115.48,38.85], “湘潭”:[112.91,27.87], “金华”:[119.64,29.12], “岳阳”:[113.09,29.37], “长沙”:[113,28.21], “衢州”:[118.88,28.97], “廊坊”:[116.7,39.53], “菏泽”:[115.480656,35.23375], “合肥”:[117.27,31.86], “武汉”:[114.31,30.52], “大庆”:[125.03,46.58] }; var convertData = function (data) { var res = []; for (var i = 0; i < data.length; i++) { var geoCoord = geoCoordMap[data[i].name]; if (geoCoord) { res.push(geoCoord.concat(data[i].value)); } } return res; }; option = { title: { text: ”, subtext: ”, left: ‘center’ }, tooltip: { trigger: ‘item’ }, legend: { orient: ‘vertical’, left: ‘left’, // data:[‘2017年’] }, visualMap: { show: false, min: 0, max: 500, // splitNumber: 250, splitNumber: 100, // max: 450, left: ‘left’, top: ‘bottom’, text: [‘高’, ‘低’], // 文本,默认为数值文本 calculable: false, // calculable: true, inRange: { //color: [ ‘#e0f3f8’, ‘#ffffbf’, ‘#fee090’, ‘#fdae61’, ‘#f46d43’, ‘#d73027’, ‘#a50026’] // color: [ ‘#FF0033’, ‘#22BF2E’] //AdminLTE: red, green // color: [ ‘#DD4B39’, ‘#00A65A’] color: [ ValueColor.RED, ValueColor.GREEN], //other: red, green // color: [ ‘#FF4500’, ‘#7FFF00’], // opacity: 1.0 } }, // toolbox: { // show: true, // orient: ‘vertical’, // left: ‘right’, // top: ‘center’, // feature: { // dataView: {readOnly: false}, // restore: {}, // saveAsImage: {} // } // }, geo: { show: true, map: ‘china’, regions: [{ name: ‘广东’, itemStyle: { normal: { areaColor: ValueColor.YELLOW, // color: ValueColor.YELLOW } } }], itemStyle: { normal: { areaColor: ValueColor.DARK_BLUE, // borderColor: ‘#111’ }, emphasis: { areaColor: ValueColor.DARK_BLUE, } } }, series: [ { name: ‘2016年’, // type: ‘map’, type: ‘scatter’, coordinateSystem: ‘geo’, // mapType: ‘china’, map: ‘china’, roam: false, label: { normal: { show: true }, emphasis: { show: true } }, // data:[ data: convertData([ //大西北区 {name: ‘甘肃’,value: 50 }, {name: ‘青海’,value: 50 }, {name: ‘新疆’,value: 50 }, {name: ‘宁夏’,value: 50 }, {name: ‘陕西’,value: 50 }, {name: ‘山西’,value: 50 }, //大中南区 {name: ‘湖南’,value: 450 }, {name: ‘江西’,value: 450 }, {name: ‘湖北’,value: 450 }, //大华东区 {name: ‘江苏’,value: 450 }, {name: ‘安徽’,value: 450 }, //大华南区 {name: ‘广东’,value: 50 }, {name: ‘海南’,value: 50 }, {name: ‘福建’,value: 50 }, //大华北区 {name: ‘黑龙江’,value: 450 }, {name: ‘吉林’,value: 450 }, {name: ‘辽宁’,value: 450 }, {name: ‘河北’,value: 450 }, {name: ‘天津’,value: 450 }, {name: ‘北京’,value: 450 }, {name: ‘内蒙古’,value: 450 }, //大华中区 {name: ‘河南’,value: 450 }, {name: ‘山东’,value: 450 }, //大东南区 {name: ‘浙江’,value: 450 }, {name: ‘上海’,value: 450 }, //大西南区 {name: ‘重庆’,value: 450 }, {name: ‘四川’,value: 450 }, {name: ‘西藏’,value: 450 }, {name: ‘云南’,value: 450 }, {name: ‘广西’,value: 450 }, {name: ‘贵州’,value: 450 }, {name: ‘台湾’,value: 450 }, {name: ‘香港’,value: 450 }, {name: ‘澳门’,value: 450 } // ] ]) }, ] }; mapEcharts.setOption(option); </script> |
效果是:
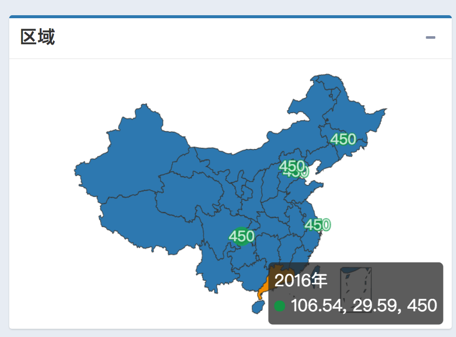
不是我想要的。
此处geo的map感觉是:
整体上全部弄成一种颜色,然后根据,x,y的坐标值,加上对应的数值,显示在对应的区域
转载请注明:在路上 » 【未解决】ECharts中的地图的设置了颜色但是显示不准确