折腾:
期间,需要去添加一个,水平方向,从左到右,的漏斗图。
然后用代码:
<script type=”text/javascript”> var convertionEcharts = echarts.init(document.getElementById(‘echart_convertion’)); option = { title: { text: ”, subtext: ” }, tooltip: { trigger: ‘item’, // formatter: “{a} <br/>{b} : {c}%” formatter: “{a} <br/>{b} : {c}” }, // toolbox: { // feature: { // dataView: {readOnly: false}, // restore: {}, // saveAsImage: {} // } // }, legend: { data: [‘线索’,’有望’,’订单’,’成交’] }, series: [ { name: ‘目标’, type: ‘funnel’, left: ‘10%’, width: ‘80%’, label: { normal: { formatter: ‘{b}预期’ }, emphasis: { position:’inside’, // formatter: ‘{b}预期: {c}%’ formatter: ‘{b}预期: {c}’ } }, labelLine: { normal: { show: false } }, itemStyle: { normal: { opacity: 0.7 } }, data: [ {value: 80, name: ‘成交’}, {value: 200, name: ‘订单’}, {value: 600, name: ‘有望’}, {value: 2000, name: ‘线索’} ] }, { name: ‘实际’, type: ‘funnel’, left: ‘10%’, width: ‘80%’, maxSize: ‘80%’, label: { normal: { position: ‘inside’, // formatter: ‘{c}%’, formatter: ‘{c}’, textStyle: { color: ‘#fff’ } }, emphasis: { position:’inside’, // formatter: ‘{b}实际: {c}%’ formatter: ‘{b}实际: {c}’ } }, itemStyle: { normal: { opacity: 0.5, borderColor: ‘#fff’, borderWidth: 2 } }, data: [ {value: 60, name: ‘成交’}, {value: 160, name: ‘订单’}, {value: 500, name: ‘有望’}, {value: 1000, name: ‘线索’} ] } ] }; convertionEcharts.setOption(option); </script> |
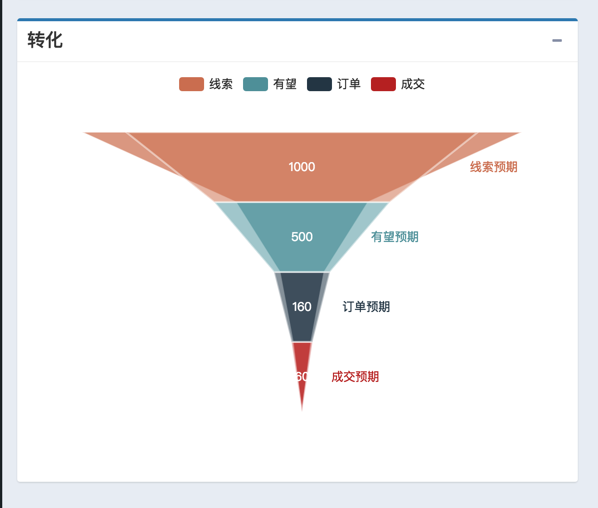
基本上实现了漏斗图:
接着重点是:
【已解决】AdminLTE中如何实现ECharts的水平的漏斗图
【总结】
完整代码:
<div class=”row”> <div class=”col-md-6″> <div class=”box box-primary”> <div class=”box-header with-border”> <h3 class=”box-title”>转化</h3> <div class=”box-tools pull-right”> <button type=”button” class=”btn btn-box-tool” data-widget=”collapse” data-toggle=”tooltip” title=”Collapse”> <i class=”fa fa-minus”></i></button> </div> </div> <div class=”box-body”> <div id=”echart_convertion” style=”width: 550px; height:400px; transform: rotate(270deg);” > </div> </div> </div> </div> 。。。 </div> <script src=”dist/lib/echarts/echarts.js”></script> <script type=”text/javascript”> var convertionEcharts = echarts.init(document.getElementById(‘echart_convertion’)); option = { title: { text: ”, subtext: ” }, tooltip: { trigger: ‘item’, // formatter: “{a} <br/>{b} : {c}%” formatter: “{a} <br/>{b} : {c}” }, // toolbox: { // feature: { // dataView: {readOnly: false}, // restore: {}, // saveAsImage: {} // } // }, legend: { data: [‘线索’,’有望’,’订单’,’成交’] }, series: [ { name: ‘目标’, type: ‘funnel’, left: ‘10%’, width: ‘80%’, label: { normal: { formatter: ‘{b}预期’ }, emphasis: { position:’inside’, // formatter: ‘{b}预期: {c}%’ formatter: ‘{b}预期: {c}’ } }, labelLine: { normal: { show: false } }, itemStyle: { normal: { opacity: 0.7 } }, data: [ {value: 80, name: ‘成交’}, {value: 200, name: ‘订单’}, {value: 600, name: ‘有望’}, {value: 2000, name: ‘线索’} ] }, { name: ‘实际’, type: ‘funnel’, left: ‘10%’, width: ‘80%’, maxSize: ‘80%’, label: { normal: { position: ‘inside’, // formatter: ‘{c}%’, formatter: ‘{c}’, textStyle: { color: ‘#fff’ } }, emphasis: { position:’inside’, // formatter: ‘{b}实际: {c}%’ formatter: ‘{b}实际: {c}’ } }, itemStyle: { normal: { opacity: 0.5, borderColor: ‘#fff’, borderWidth: 2 } }, data: [ {value: 60, name: ‘成交’}, {value: 160, name: ‘订单’}, {value: 500, name: ‘有望’}, {value: 1000, name: ‘线索’} ] } ] }; convertionEcharts.setOption(option); </script> |
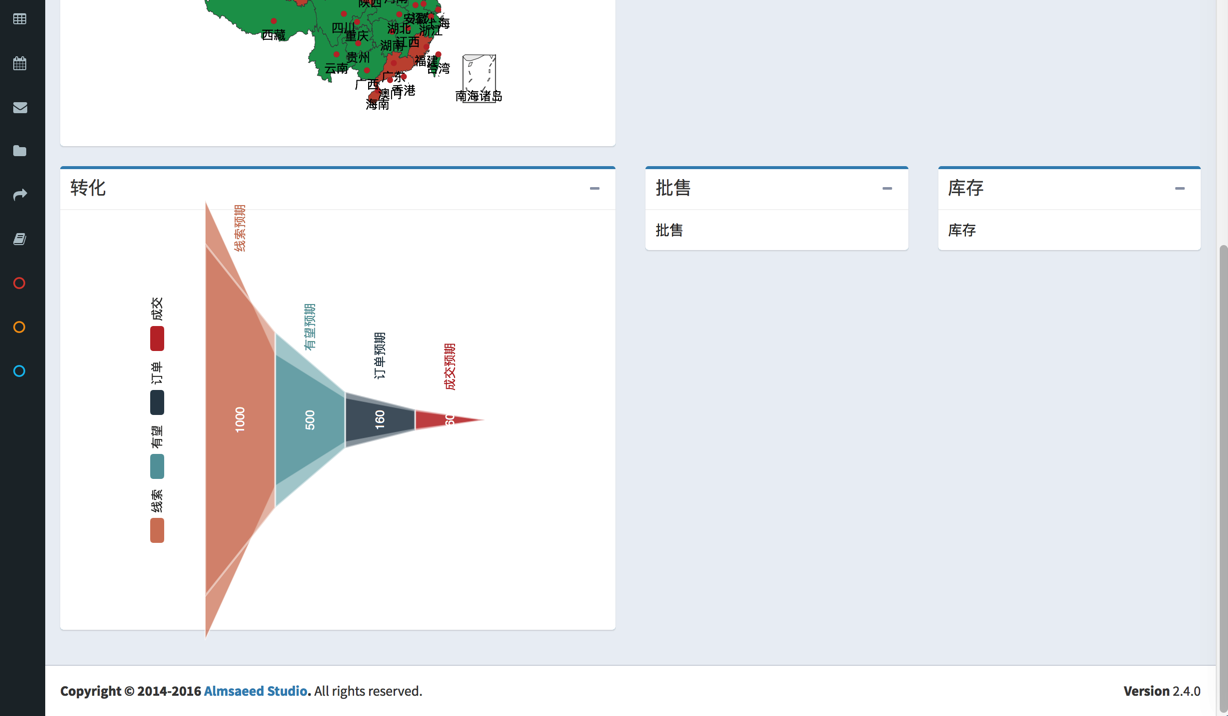
效果:
转载请注明:在路上 » 【已解决】AdminLTE中添加水平方向的漏斗图