已经用:
安装好了Charts的库,现在尝试在iOS中用swift去使用
-》
Charts/ChartsDemo at master · danielgindi/Charts
文档:
Home · PhilJay/MPAndroidChart Wiki
API:
Overview (MPChartLib v2.2.4 API)
去下载:
https://github.com/danielgindi/Charts/archive/master.zip
找demo看看
虽然搞懂了原因,但是没有搞定如何继续运行demo项目。
没法看效果。
只能看oc的代码。。。
swift charts library demo
Looking for Swift tutorial on iOS Charts:swift
iOS Swift Tutorial: Fitness tracking and iOS charts
How To Draw Graphs with Core Plot, Part 1
然后参考这个:
How to Use iOS Charts API to Create Beautiful Charts in Swift
最后用如下代码:
//
// ReportViewController.swift
// QorosSales
//
// Created by licrifan on 16/5/12.
// Copyright © 2016年 licrifan. All rights reserved.
//
import UIKit
import Charts
class ReportViewController: UIViewController, ChartViewDelegate {
var barChartView: BarChartView
init(){
self.barChartView = BarChartView()
super.init(nibName: nil, bundle: nil)
}
required init?(coder aDecoder: NSCoder) {
fatalError("init(coder:) has not been implemented")
}
override func viewDidLoad() {
super.viewDidLoad()
print("self.view.frame=\(self.view.frame)")
//(0.0, 0.0, 320.0, 568.0)
self.title = "报表统计"
self.view.backgroundColor = UIColor.whiteColor()
self.view.addSubview(self.barChartView)
barChartView.frame = CGRectMake(
self.view.frame.origin.x,
self.view.frame.origin.y + UIApplication.sharedApplication().statusBarFrame.height,
UIScreen.mainScreen().bounds.width,
UIScreen.mainScreen().bounds.height //667
– UIApplication.sharedApplication().statusBarFrame.height //20
– self.tabBarController!.tabBar.frame.height) //49
print("barChartView.frame=\(barChartView.frame)")
//(0.0, 20.0, 375.0, 598.0)
//print("UIApplication.sharedApplication().statusBarFrame=\(UIApplication.sharedApplication().statusBarFrame)")
//(0.0, 0.0, 320.0, 20.0)
// constrain(barChartView) { barChartView in
// barChartView.top == barChartView.superview!.top + UIApplication.sharedApplication().statusBarFrame.height
// barChartView.bottom == barChartView.superview!.bottom
// barChartView.left == barChartView.superview!.left
// barChartView.right == barChartView.superview!.right
// barChartView.center == barChartView.superview!.center
// }
//config bar chart view
barChartView.delegate = self
barChartView.descriptionText = "统计数据"
barChartView.noDataText = "暂无数据"
barChartView.noDataTextDescription = "没有找到有效数据"
barChartView.dragEnabled = true
barChartView.drawBarShadowEnabled = false
barChartView.drawValueAboveBarEnabled = true
// barChartView.maxVisibleValueCount = 60
barChartView.pinchZoomEnabled = true
barChartView.drawGridBackgroundEnabled = true
barChartView.drawBordersEnabled = true
barChartView.drawHighlightArrowEnabled = true
//init data
// let months = ["Jan", "Feb", "Mar", "Apr", "May", "Jun", "Jul", "Aug", "Sep", "Oct", "Nov", "Dec"]
// let unitsSold = [20.0, 4.0, 6.0, 3.0, 12.0, 16.0, 4.0, 18.0, 2.0, 4.0, 5.0, 4.0]
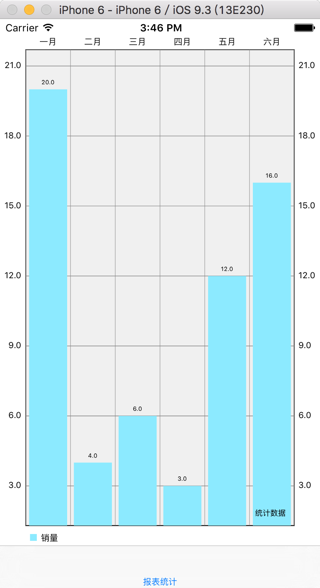
let months = ["一月", "二月", "三月", "四月", "五月", "六月"]
let unitsSold = [20.0, 4.0, 6.0, 3.0, 12.0, 16.0]
//set values
setChart(months, values: unitsSold)
}
override func didReceiveMemoryWarning() {
super.didReceiveMemoryWarning()
}
func setChart(dataPoints: [String], values: [Double]) {
var dataEntries: [BarChartDataEntry] = []
for i in 0..<dataPoints.count {
let dataEntry = BarChartDataEntry(value: values[i], xIndex: i)
dataEntries.append(dataEntry)
}
let chartDataSet = BarChartDataSet(yVals: dataEntries, label: "销量")
let chartData = BarChartData(xVals: dataPoints, dataSet: chartDataSet)
print("chartData=\(chartData)")
barChartView.data = chartData
}
}
效果如图所示:
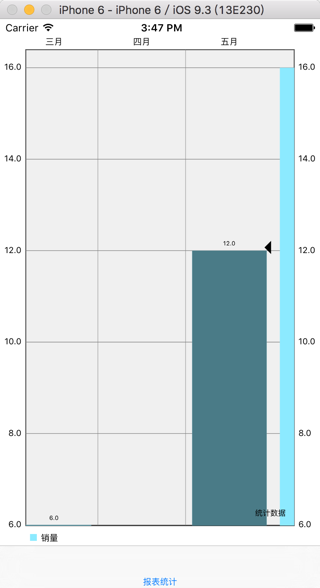
双击(鼠标)后,可以放大:
然后再去试试,线line的图表:
//
// ReportViewController.swift
// QorosSales
//
// Created by licrifan on 16/5/12.
// Copyright © 2016年 licrifan. All rights reserved.
//
import UIKit
import Charts
class ReportViewController: UIViewController, ChartViewDelegate {
var lineChartView:LineChartView
let ChartLabelHeight:CGFloat = 30
var TabBarHeight:CGFloat = 0
init(){
//self.barChartView = BarChartView()
self.lineChartView = LineChartView()
super.init(nibName: nil, bundle: nil)
}
required init?(coder aDecoder: NSCoder) {
fatalError("init(coder:) has not been implemented")
}
override func viewDidLoad() {
super.viewDidLoad()
if let tabBarController = self.tabBarController {
TabBarHeight = tabBarController.tabBar.frame.height //49
}
print("self.view.frame=\(self.view.frame)")
//(0.0, 0.0, 320.0, 568.0)
self.title = "报表统计"
self.view.backgroundColor = UIColor.whiteColor()
//init data
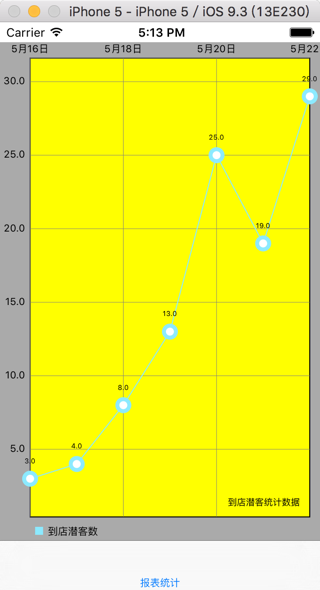
let dayList:[String] = ["5月16日", "5月17日", "5月18日", "5月19日", "5月20日", "5月21日", "5月22日"]
let potentialGuestNumList:[Double] = [3, 4, 8, 13, 25, 19, 29]
self.view.addSubview(self.lineChartView)
constrain(lineChartView) { lineChartView in
lineChartView.top == lineChartView.superview!.top + UIApplication.sharedApplication().statusBarFrame.height
lineChartView.bottom == lineChartView.superview!.bottom – TabBarHeight
lineChartView.left == lineChartView.superview!.left
lineChartView.right == lineChartView.superview!.right
}
lineChartView.delegate = self
lineChartView.descriptionText = "到店潜客统计数据"
lineChartView.noDataText = "暂无数据"
lineChartView.noDataTextDescription = "没有找到有效数据"
lineChartView.dragEnabled = true
lineChartView.setScaleEnabled(true)
lineChartView.drawGridBackgroundEnabled = true
lineChartView.gridBackgroundColor = UIColor.yellowColor()
lineChartView.pinchZoomEnabled = true
lineChartView.drawBordersEnabled = true
lineChartView.backgroundColor = UIColor.lightGrayColor()
lineChartView.animate(xAxisDuration: 2.5, easingOption: ChartEasingOption.EaseInOutQuart)
lineChartView.leftAxis.enabled = true
lineChartView.rightAxis.enabled = false
setLineChart(dayList, yValues: potentialGuestNumList, dataLabel: "到店潜客数")
}
override func didReceiveMemoryWarning() {
super.didReceiveMemoryWarning()
}
func setLineChart(xPoints: [String], yValues: [Double], dataLabel:String) {
var dataEntries: [ChartDataEntry] = []
for i in 0..<xPoints.count {
let dataEntry = ChartDataEntry(value: yValues[i], xIndex: i)
dataEntries.append(dataEntry)
}
let chartDataSet = LineChartDataSet(yVals: dataEntries, label: dataLabel)
let chartData = LineChartData(xVals: xPoints, dataSet: chartDataSet)
print("chartData=\(chartData)")
lineChartView.data = chartData
}
}
效果:
然后再去弄,X的双轴的线line的图表,代码:
//
// ReportViewController.swift
// QorosSales
//
// Created by licrifan on 16/5/12.
// Copyright © 2016年 licrifan. All rights reserved.
//
import UIKit
import Charts
class ReportViewController: UIViewController, ChartViewDelegate {
var lineChartView:LineChartView
let ChartLabelHeight:CGFloat = 30
var TabBarHeight:CGFloat = 0
init(){
self.lineChartView = LineChartView()
super.init(nibName: nil, bundle: nil)
}
required init?(coder aDecoder: NSCoder) {
fatalError("init(coder:) has not been implemented")
}
override func viewDidLoad() {
super.viewDidLoad()
if let tabBarController = self.tabBarController {
TabBarHeight = tabBarController.tabBar.frame.height //49
}
print("self.view.frame=\(self.view.frame)")
//(0.0, 0.0, 320.0, 568.0)
self.title = "报表统计"
self.view.backgroundColor = UIColor.whiteColor()
//init data
let dayList:[String] = ["5月16日", "5月17日", "5月18日", "5月19日", "5月20日", "5月21日", "5月22日"]
let entranceGuestNumList:[Double] = [3, 4, 8, 13, 25, 19, 29]
let potentialGuestNumList:[Double] = [3, 7, 15, 19, 30, 31, 40]
self.view.addSubview(self.lineChartView)
constrain(lineChartView) { lineChartView in
lineChartView.top == lineChartView.superview!.top + UIApplication.sharedApplication().statusBarFrame.height
lineChartView.bottom == lineChartView.superview!.bottom – TabBarHeight
lineChartView.left == lineChartView.superview!.left
lineChartView.right == lineChartView.superview!.right
}
lineChartView.delegate = self
lineChartView.descriptionText = "到店流量和潜客统计数据"
lineChartView.noDataText = "暂无数据"
lineChartView.noDataTextDescription = "没有找到有效数据"
lineChartView.dragEnabled = true
lineChartView.setScaleEnabled(true)
lineChartView.drawGridBackgroundEnabled = true
lineChartView.gridBackgroundColor = UIColor.yellowColor()
lineChartView.pinchZoomEnabled = true
lineChartView.drawBordersEnabled = true
//lineChartView.backgroundColor = UIColor.cyanColor()
// lineChartView.backgroundColor = UIColor.brownColor()
// lineChartView.backgroundColor = UIColor.lightTextColor()
lineChartView.backgroundColor = UIColor.lightGrayColor()
// lineChartView.backgroundColor = UIColor.purpleColor()
lineChartView.animate(xAxisDuration: 2.5, easingOption: ChartEasingOption.EaseInOutQuart)
let xAxis:ChartXAxis = lineChartView.xAxis
xAxis.drawAxisLineEnabled = false
xAxis.drawGridLinesEnabled = false
// xAxis.labelFont = UIFont.systemFontOfSize(12)
// xAxis.labelTextColor = UIColor.whiteColor()
// xAxis.spaceBetweenLabels = 1.0
let leftColor:UIColor = UIColor.cyanColor()
let leftAxis:ChartYAxis = lineChartView.leftAxis
leftAxis.labelTextColor = leftColor
// leftAxis.axisMaxValue = 100.0
leftAxis.axisMinValue = 0.0
leftAxis.drawGridLinesEnabled = true
leftAxis.drawZeroLineEnabled = false
leftAxis.granularityEnabled = true
let rightColor:UIColor = UIColor.redColor()
let rightAxis:ChartYAxis = lineChartView.rightAxis
rightAxis.labelTextColor = rightColor
// rightAxis.axisMaxValue = 100.0
rightAxis.axisMinValue = 0.0
rightAxis.drawGridLinesEnabled = false
rightAxis.granularityEnabled = false
setDoubleLineChart(dayList, leftAxisValues: potentialGuestNumList, rightAxisValues: entranceGuestNumList, leftAxisLabel: "到店流量", rightAxisLabel: "到店潜客", leftColor: leftColor, rightColor: rightColor)
}
override func didReceiveMemoryWarning() {
super.didReceiveMemoryWarning()
}
func setDoubleLineChart(xPoints: [String], leftAxisValues: [Double], rightAxisValues:[Double], leftAxisLabel:String, rightAxisLabel:String, leftColor:UIColor = UIColor.cyanColor(), rightColor:UIColor = UIColor.redColor()) {
var leftDataEntrieList: [ChartDataEntry] = []
var rightDataEntrieList: [ChartDataEntry] = []
for i in 0..<xPoints.count {
let leftDataEntry = ChartDataEntry(value: leftAxisValues[i], xIndex: i)
leftDataEntrieList.append(leftDataEntry)
let rightDataEntry = ChartDataEntry(value: rightAxisValues[i], xIndex: i)
rightDataEntrieList.append(rightDataEntry)
}
let leftChartDataSet = LineChartDataSet(yVals: leftDataEntrieList, label: leftAxisLabel)
leftChartDataSet.setColor(leftColor)
leftChartDataSet.fillColor = leftColor
leftChartDataSet.setCircleColor(leftColor)
let rightChartDataSet = LineChartDataSet(yVals: rightDataEntrieList, label: rightAxisLabel)
rightChartDataSet.setColor(rightColor)
rightChartDataSet.fillColor = rightColor
rightChartDataSet.setCircleColor(rightColor)
var dataSetList:[LineChartDataSet] = [LineChartDataSet]()
dataSetList.append(leftChartDataSet)
dataSetList.append(rightChartDataSet)
//init common settings
for eachDataSet in dataSetList {
eachDataSet.drawCircleHoleEnabled = false
eachDataSet.lineWidth = 1.0
eachDataSet.circleRadius = 4.0
eachDataSet.fillAlpha = 65/255.0
}
let totalChartData = LineChartData(xVals: xPoints, dataSets: dataSetList)
lineChartView.data = totalChartData
}
}
效果:
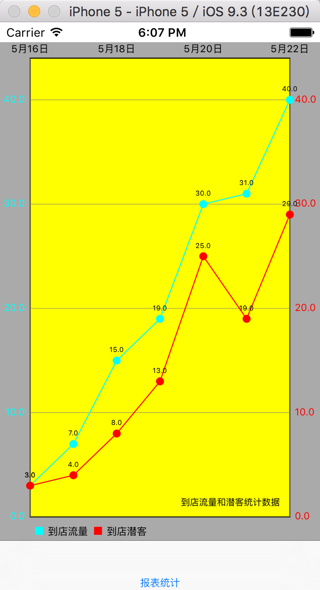
最后集成了4个:
x带双轴的线line图表
x单轴的的线line图表
柱状图bar
饼图
代码:
//
// ReportViewController.swift
// QorosSales
//
// Created by licrifan on 16/5/12.
// Copyright © 2016年 licrifan. All rights reserved.
//
import UIKit
import Charts
class ReportViewController: UIViewController, ChartViewDelegate {
var TabBarHeight:CGFloat = 0
let ChartViewPaddingHeight:CGFloat = 2
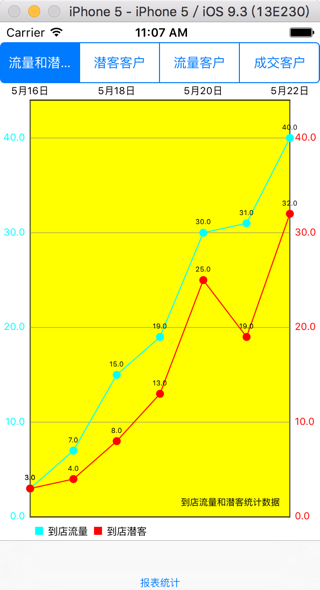
let guestTypeList:[String] = ["流量和潜客客户", "潜客客户", "流量客户", "成交客户"]
let dayList:[String] = ["5月16日", "5月17日", "5月18日", "5月19日", "5月20日", "5月21日", "5月22日"]
let entranceGuestNumList:[Double] = [3, 4, 8, 13, 25, 19, 32]
let potentialGuestNumList:[Double] = [3, 7, 15, 19, 30, 31, 40]
var guestSegmentControl:UISegmentedControl
let SegmentHeight:CGFloat = 40
let SegmentIndexEntranceGuest:Int = 0
let SegmentIndexPotentialGuest:Int = 1
let SegmentIndexFlowGuest:Int = 2
let SegmentIndexDealWithGuest:Int = 3
var chartView:UIView
var entranceGuestChartView:LineChartView
var potentialGuestChartView:LineChartView
var flowGuestChartView:BarChartView
var dealWithGuestChartView:PieChartView
init(){
self.guestSegmentControl = UISegmentedControl(items: guestTypeList)
self.chartView = UIView()
self.entranceGuestChartView = LineChartView()
self.potentialGuestChartView = LineChartView()
self.flowGuestChartView = BarChartView()
self.dealWithGuestChartView = PieChartView()
super.init(nibName: nil, bundle: nil)
}
required init?(coder aDecoder: NSCoder) {
fatalError("init(coder:) has not been implemented")
}
override func viewDidLoad() {
super.viewDidLoad()
if let tabBarController = self.tabBarController {
TabBarHeight = tabBarController.tabBar.frame.height //49
}
self.title = "报表统计"
self.view.backgroundColor = UIColor.whiteColor()
//print("self.view.frame=\(self.view.frame)")
//(0.0, 0.0, 320.0, 568.0)
self.guestSegmentControl.addTarget(self, action: #selector(ReportViewController.segmentValueChanged), forControlEvents: UIControlEvents.ValueChanged)
// self.guestSegmentControl.tintColor = UIColor.blueColor()
self.view.addSubview(self.guestSegmentControl)
constrain(guestSegmentControl) { guestSegmentControl in
guestSegmentControl.top == guestSegmentControl.superview!.top + UIApplication.sharedApplication().statusBarFrame.height
guestSegmentControl.height == SegmentHeight
guestSegmentControl.left == guestSegmentControl.superview!.left
guestSegmentControl.right == guestSegmentControl.superview!.right
}
//print("self.guestSegmentControl.frame=\(self.guestSegmentControl.frame)")
//(0.0, 0.0, 200.0, 29.0)
self.chartView.backgroundColor = UIColor.whiteColor()
self.view.addSubview(self.chartView)
constrain(chartView, guestSegmentControl) { chartView, guestSegmentControl in
chartView.top == guestSegmentControl.bottom + ChartViewPaddingHeight
chartView.bottom == chartView.superview!.bottom – TabBarHeight
chartView.left == chartView.superview!.left
chartView.right == chartView.superview!.right
}
initEntranceGuestChartView()
initPotentialGuestChartView()
iniFlowGuestChartView()
initDealWithGuestChartView()
//print("self.guestSegmentControl.selectedSegmentIndex=\(self.guestSegmentControl.selectedSegmentIndex)") //-1
self.guestSegmentControl.selectedSegmentIndex = SegmentIndexEntranceGuest
loadChartView(self.guestSegmentControl.selectedSegmentIndex)
}
override func didReceiveMemoryWarning() {
super.didReceiveMemoryWarning()
}
func commonLineBarChartViewSettings(curChartView:BarLineChartViewBase) {
curChartView.delegate = self
curChartView.noDataText = "暂无数据"
curChartView.noDataTextDescription = "没有找到有效数据"
curChartView.dragEnabled = true
curChartView.setScaleEnabled(true)
curChartView.drawGridBackgroundEnabled = true
curChartView.gridBackgroundColor = UIColor.yellowColor()
curChartView.pinchZoomEnabled = true
curChartView.drawBordersEnabled = true
if curChartView is BarChartView {
let curBarChatView = curChartView as! BarChartView
curBarChatView.drawBarShadowEnabled = false
curBarChatView.drawHighlightArrowEnabled = true
}
//curChartView.backgroundColor = UIColor.cyanColor()
//curChartView.backgroundColor = UIColor.brownColor()
curChartView.backgroundColor = UIColor.lightTextColor()
// curChartView.backgroundColor = UIColor.lightGrayColor()
//curChartView.backgroundColor = UIColor.purpleColor()
}
func initEntranceGuestChartView() {
commonLineBarChartViewSettings(entranceGuestChartView)
entranceGuestChartView.descriptionText = "到店流量和潜客统计数据"
let xAxis:ChartXAxis = entranceGuestChartView.xAxis
xAxis.drawAxisLineEnabled = false
xAxis.drawGridLinesEnabled = false
// xAxis.labelFont = UIFont.systemFontOfSize(12)
// xAxis.labelTextColor = UIColor.whiteColor()
// xAxis.spaceBetweenLabels = 1.0
let leftColor:UIColor = UIColor.cyanColor()
// let leftColor:UIColor = UIColor.blueColor()
// let leftColor:UIColor = UIColor.purpleColor()
// let leftColor:UIColor = UIColor.magentaColor()
// let leftColor:UIColor = UIColor.greenColor()
let leftAxis:ChartYAxis = entranceGuestChartView.leftAxis
leftAxis.labelTextColor = leftColor
// leftAxis.axisMaxValue = 100.0
leftAxis.axisMinValue = 0.0
leftAxis.drawGridLinesEnabled = true
leftAxis.drawZeroLineEnabled = false
leftAxis.granularityEnabled = true
let rightColor:UIColor = UIColor.redColor()
let rightAxis:ChartYAxis = entranceGuestChartView.rightAxis
rightAxis.labelTextColor = rightColor
// rightAxis.axisMaxValue = 100.0
rightAxis.axisMinValue = 0.0
rightAxis.drawGridLinesEnabled = false
rightAxis.granularityEnabled = false
setDoubleLineChart(entranceGuestChartView, xPoints: dayList, leftAxisValues: potentialGuestNumList, rightAxisValues: entranceGuestNumList, leftAxisLabel: "到店流量", rightAxisLabel: "到店潜客", leftColor: leftColor, rightColor: rightColor)
}
func setDoubleLineChart(curDoubleLineChartView:LineChartView, xPoints: [String], leftAxisValues: [Double], rightAxisValues:[Double], leftAxisLabel:String, rightAxisLabel:String, leftColor:UIColor = UIColor.cyanColor(), rightColor:UIColor = UIColor.redColor()) {
var leftDataEntrieList: [ChartDataEntry] = []
var rightDataEntrieList: [ChartDataEntry] = []
for i in 0..<xPoints.count {
let leftDataEntry = ChartDataEntry(value: leftAxisValues[i], xIndex: i)
leftDataEntrieList.append(leftDataEntry)
let rightDataEntry = ChartDataEntry(value: rightAxisValues[i], xIndex: i)
rightDataEntrieList.append(rightDataEntry)
}
let leftChartDataSet = LineChartDataSet(yVals: leftDataEntrieList, label: leftAxisLabel)
leftChartDataSet.setColor(leftColor)
leftChartDataSet.fillColor = leftColor
leftChartDataSet.setCircleColor(leftColor)
let rightChartDataSet = LineChartDataSet(yVals: rightDataEntrieList, label: rightAxisLabel)
rightChartDataSet.setColor(rightColor)
rightChartDataSet.fillColor = rightColor
rightChartDataSet.setCircleColor(rightColor)
var dataSetList:[LineChartDataSet] = [LineChartDataSet]()
dataSetList.append(leftChartDataSet)
dataSetList.append(rightChartDataSet)
//init common settings
for eachDataSet in dataSetList {
eachDataSet.drawCircleHoleEnabled = false
eachDataSet.lineWidth = 1.0
eachDataSet.circleRadius = 4.0
eachDataSet.fillAlpha = 65/255.0
}
let totalChartData = LineChartData(xVals: xPoints, dataSets: dataSetList)
curDoubleLineChartView.data = totalChartData
}
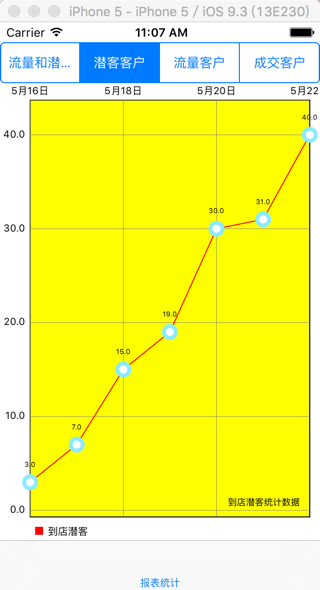
func initPotentialGuestChartView() {
commonLineBarChartViewSettings(potentialGuestChartView)
potentialGuestChartView.descriptionText = "到店潜客统计数据"
potentialGuestChartView.leftAxis.enabled = true
potentialGuestChartView.rightAxis.enabled = false
setSingleLineChart(potentialGuestChartView, xPointList: dayList, leftYAXisValues: potentialGuestNumList, leftYAxisLabel: "到店潜客")
}
func setSingleLineChart(curLineChartView:LineChartView, xPointList: [String], leftYAXisValues: [Double], leftYAxisLabel:String, lineColor:UIColor = UIColor.redColor()) {
var leftYDataEntryList: [ChartDataEntry] = []
for i in 0..<xPointList.count {
let leftYAxisDataEntry = ChartDataEntry(value: leftYAXisValues[i], xIndex: i)
leftYDataEntryList.append(leftYAxisDataEntry)
}
let leftYAxisChartDataSet = LineChartDataSet(yVals: leftYDataEntryList, label: leftYAxisLabel)
leftYAxisChartDataSet.setColor(lineColor)
let leftYAxisChartData = LineChartData(xVals: xPointList, dataSet: leftYAxisChartDataSet)
print("leftYAxisChartData=\(leftYAxisChartData)")
curLineChartView.data = leftYAxisChartData
}
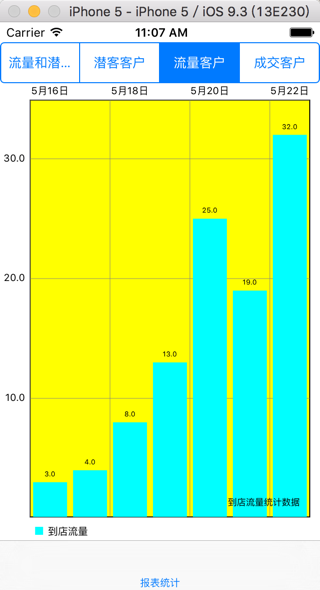
func iniFlowGuestChartView() {
commonLineBarChartViewSettings(flowGuestChartView)
flowGuestChartView.descriptionText = "到店流量统计数据"
flowGuestChartView.leftAxis.enabled = true
flowGuestChartView.rightAxis.enabled = false
setSingleBarChart(flowGuestChartView, xPointList: dayList, leftYAXisValues: entranceGuestNumList, leftYAxisLabel: "到店流量")
}
func setSingleBarChart(curBarChartView:BarChartView, xPointList: [String], leftYAXisValues: [Double], leftYAxisLabel:String, barColor:UIColor = UIColor.cyanColor()) {
var leftYDataEntryList: [BarChartDataEntry] = []
for i in 0..<xPointList.count {
let leftYAxisDataEntry = BarChartDataEntry(value: leftYAXisValues[i], xIndex: i)
leftYDataEntryList.append(leftYAxisDataEntry)
}
let leftYAxisChartDataSet = BarChartDataSet(yVals: leftYDataEntryList, label: leftYAxisLabel)
leftYAxisChartDataSet.setColor(barColor)
let leftYAxisChartData = BarChartData(xVals: xPointList, dataSet: leftYAxisChartDataSet)
print("leftYAxisChartData=\(leftYAxisChartData)")
curBarChartView.data = leftYAxisChartData
}
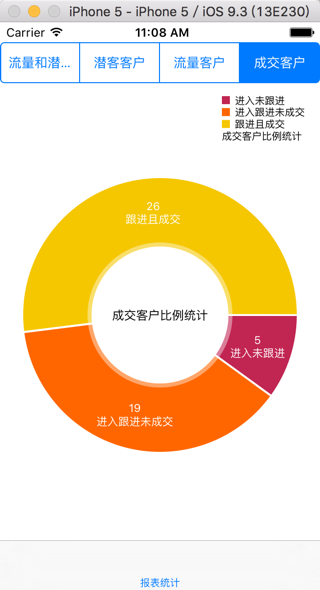
func initDealWithGuestChartView() {
let dealTypeList:[String] = ["进入未跟进", "进入跟进未成交", "跟进且成交"]
let diffDealTypeNumList:[Double] = [5, 19, 26]
let labelStr = "成交客户比例统计"
//commomPieChartViewSettings(dealWithGuestChartView, centerText: labelStr)
commomPieChartViewSettings(dealWithGuestChartView, centerText: labelStr, isValueUsePercent: false)
setPieChart(dealWithGuestChartView, xLabelList: dealTypeList, yValueList: diffDealTypeNumList, label: labelStr)
}
func commomPieChartViewSettings(curPieChartView:PieChartView, centerText:String = "", isValueUsePercent:Bool = true) {
curPieChartView.descriptionText = ""
curPieChartView.usePercentValuesEnabled = isValueUsePercent
let InnerCirclePaddingPercent:CGFloat = 0.03
curPieChartView.drawSlicesUnderHoleEnabled = false
// curPieChartView.holeRadiusPercent = 0.58
curPieChartView.holeRadiusPercent = 0.50
// curPieChartView.transparentCircleRadiusPercent = 0.61
curPieChartView.transparentCircleRadiusPercent = curPieChartView.holeRadiusPercent + InnerCirclePaddingPercent
curPieChartView.setExtraOffsets(left: 5.0, top: 10.0, right: 5.0, bottom: 5.0)
curPieChartView.drawCenterTextEnabled = true
let paraStyle:NSMutableParagraphStyle = NSMutableParagraphStyle()
paraStyle.alignment = .Center
paraStyle.lineBreakMode = .ByCharWrapping
let attributedCenterText:NSMutableAttributedString = NSMutableAttributedString(string: centerText)
attributedCenterText.addAttributes([NSParagraphStyleAttributeName : paraStyle], range: NSMakeRange(0, centerText.characters.count))
curPieChartView.centerText = centerText
curPieChartView.drawHoleEnabled = true
curPieChartView.rotationAngle = 0.0
curPieChartView.rotationEnabled = true
curPieChartView.highlightPerTapEnabled = true
let pieLegend:ChartLegend = curPieChartView.legend
pieLegend.position = ChartLegend.ChartLegendPosition.RightOfChart
pieLegend.xEntrySpace = 7.0
// pieLegend.xEntrySpace = 3.0
pieLegend.yEntrySpace = 0.0
pieLegend.yOffset = 0.0
}
func setPieChart(curPieChartView:PieChartView, xLabelList: [String], yValueList: [Double], label:String) {
var yDataEntryList: [BarChartDataEntry] = []
for i in 0..<yValueList.count {
let yDataEntry = BarChartDataEntry(value: yValueList[i], xIndex: i)
yDataEntryList.append(yDataEntry)
}
let pieChartDataSet = PieChartDataSet(yVals: yDataEntryList, label: label)
print("pieChartDataSet=\(pieChartDataSet)")
pieChartDataSet.sliceSpace = 2.0
//add colors
pieChartDataSet.colors = ChartColorTemplates.colorful()
// pieChartDataSet.colors = ChartColorTemplates.joyful()
// pieChartDataSet.colors = ChartColorTemplates.liberty()
// pieChartDataSet.colors = ChartColorTemplates.pastel()
// pieChartDataSet.colors = ChartColorTemplates.vordiplom()
let pieChartData = PieChartData(xVals: xLabelList, dataSet: pieChartDataSet)
print("pieChartData=\(pieChartData)")
if curPieChartView.usePercentValuesEnabled {
let numberFormatter:NSNumberFormatter = NSNumberFormatter()
numberFormatter.numberStyle = NSNumberFormatterStyle.PercentStyle
numberFormatter.maximumFractionDigits = 1
numberFormatter.multiplier = 1.0
numberFormatter.percentSymbol = " %"
pieChartData.setValueFormatter(numberFormatter)
} else {
let numberFormatter:NSNumberFormatter = NSNumberFormatter()
numberFormatter.numberStyle = NSNumberFormatterStyle.NoStyle
numberFormatter.maximumFractionDigits = 0
pieChartData.setValueFormatter(numberFormatter)
}
pieChartData.setValueFont(UIFont.systemFontOfSize(11))
pieChartData.setValueTextColor(UIColor.whiteColor())
curPieChartView.data = pieChartData
curPieChartView.highlightValues([])
}
func segmentValueChanged(sender:UISegmentedControl) {
print("sender=\(sender)")
//<UISegmentedControl: 0x7a144a80; frame = (0 20; 320 41); opaque = NO; layer = <CALayer: 0x7a144de0>>
loadChartView(sender.selectedSegmentIndex)
}
func loadChartView(curIdx:Int) {
print("curIdx=\(curIdx)") //0
for eachOldChartSubview in self.chartView.subviews {
print("eachOldChartSubview=\(eachOldChartSubview)")
eachOldChartSubview.removeFromSuperview()
}
switch curIdx {
case SegmentIndexEntranceGuest:
self.chartView.addSubview(self.entranceGuestChartView)
entranceGuestChartView.animate(xAxisDuration: 1.0, easingOption: ChartEasingOption.EaseInOutQuart)
case SegmentIndexPotentialGuest:
self.chartView.addSubview(self.potentialGuestChartView)
potentialGuestChartView.animate(xAxisDuration: 1.0, easingOption: ChartEasingOption.EaseInOutCubic)
case SegmentIndexFlowGuest:
self.chartView.addSubview(self.flowGuestChartView)
flowGuestChartView.animate(xAxisDuration: 1.0, easingOption: ChartEasingOption.EaseInOutQuad)
case SegmentIndexDealWithGuest:
self.chartView.addSubview(self.dealWithGuestChartView)
dealWithGuestChartView.animate(xAxisDuration: 1.0, easingOption: ChartEasingOption.EaseOutBack)
default:
break
}
for eachNewChartSubview in self.chartView.subviews {
print("eachNewChartSubview=\(eachNewChartSubview)")
//<Charts.LineChartView: 0x79886000; frame = (0 0; 0 0); gestureRecognizers = <NSArray: 0x7a10c8b0>; layer = <CALayer: 0x7878f420>>
constrain(eachNewChartSubview) { eachNewChartSubview in
eachNewChartSubview.top == eachNewChartSubview.superview!.top
eachNewChartSubview.bottom == eachNewChartSubview.superview!.bottom
eachNewChartSubview.left == eachNewChartSubview.superview!.left
eachNewChartSubview.right == eachNewChartSubview.superview!.right
}
}
}
}
效果:
转载请注明:在路上 » [记录]iOS中尝试折腾swift的图表的库:Charts