折腾:
【已解决】ReactJS中如何给ECharts中添加柱状图点击事件
期间,已有代码:
let curEchartsOption = { color: [‘#3398DB’], tooltip : { trigger: ‘axis’, axisPointer : { // 坐标轴指示器,坐标轴触发有效 type : ‘shadow’ // 默认为直线,可选为:’line’ | ‘shadow’ } }, grid: { left: ‘3%’, right: ‘4%’, bottom: ‘3%’, containLabel: true }, xAxis : [ { type : ‘category’, data : [‘Yeti野帝’, ‘SK’, ‘全新晶锐’, ‘明锐旅行车’, ‘2017款昕锐’, ‘2017款明锐’, ‘明锐经典款’, ‘2017款昕动’, ‘Yeti’], axisTick: { alignWithLabel: true, }, } ], yAxis : [ { type : ‘value’ } ], series : [ { name:’直接访问’, type:’bar’, barWidth: ‘60%’, data:[9, 26, 10, 1, 2, 37, 27, 1, 1] } ] }; |
效果是:
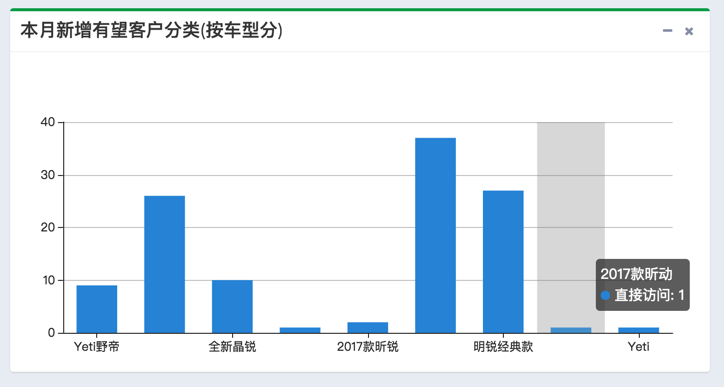
所以问题是:
希望x轴文字都可以显示
参考:
去设置:
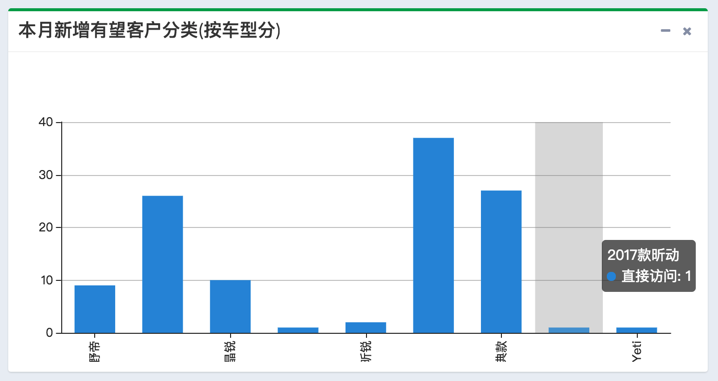
xAxis : [ { axisLabel: { rotate: 90 } |
结果,虽然文字旋转了,但是之前没显示的文字,还是没有显示:
【总结】
后来还是参考了别人的做法,
其中主要是:
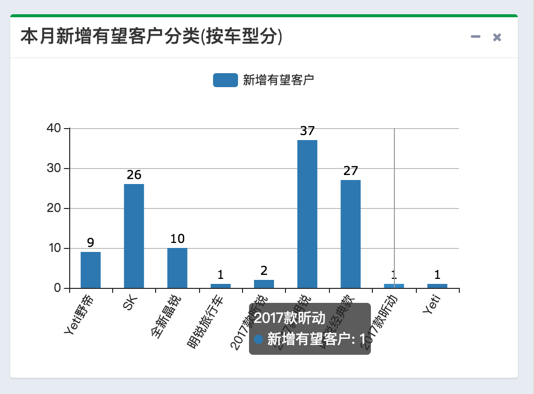
axisLabel: { interval: 0, rotate: 60 }, |
起的效果。
完整的配置:
var curEchartsOption = { // title : { // text:’本月新增有望客户分类(按车型分)’, // textStyle :{ // fontWeight:’normal’, // fontSize:’14’ // }, // // subtext:datName, // subtext: ‘DCC’, // subtextStyle:{ // fontWeight:’normal’, // fontSize:’14’, // color:’red’ // }, // top:10, // left: 10 // }, tooltip: { trigger: ‘axis’ }, toolbox: { feature: { dataView: {show: false, readOnly: true}, magicType: {show: false, type: [‘bar’]}, restore: {show: false}, saveAsImage: {show: false} } }, legend: { // left: ‘75%’, // top:33, top: 0, data:[‘新增有望客户’] }, grid:{ bottom:80 }, xAxis: [ { type: ‘category’, axisLabel: { interval:0, rotate:60 }, // data:hopeNameArr data: [‘Yeti野帝’, ‘SK’, ‘全新晶锐’, ‘明锐旅行车’, ‘2017款昕锐’, ‘2017款明锐’, ‘明锐经典款’, ‘2017款昕动’, ‘Yeti’], } ], yAxis: [ { type: ‘value’, min: 0, //max: 200, // interval: 30, axisLabel: { formatter: ‘{value}’ } } ], series: [ { name:’新增有望客户’, type:’bar’, barWidth : 20,//柱图宽度 label: { normal: { show: true, color:’red’, position: ‘top’, textStyle: { color: ‘black’, fontFamily: ‘verdana’, fontSize: 12, fontStyle: ‘normal’ } } }, itemStyle: { // normal:{color:’#C0DDAD’ } // normal:{color:’#3398DB’ } normal:{color: ValueColor.DARK_BLUE } }, // data:hopeNameArrNum data: [9, 26, 10, 1, 2, 37, 27, 1, 1] } ] }; |
达到了要的效果:
转载请注明:在路上 » 【已解决】ECharts中如何让x轴上的标签全部显示